
- Retrait en 2 heures
- Assortiment impressionnant
- Paiement sécurisé
- Toujours un magasin près de chez vous
- Retrait en 2 heures
- Assortiment impressionnant
- Paiement sécurisé
- Toujours un magasin près de chez vous


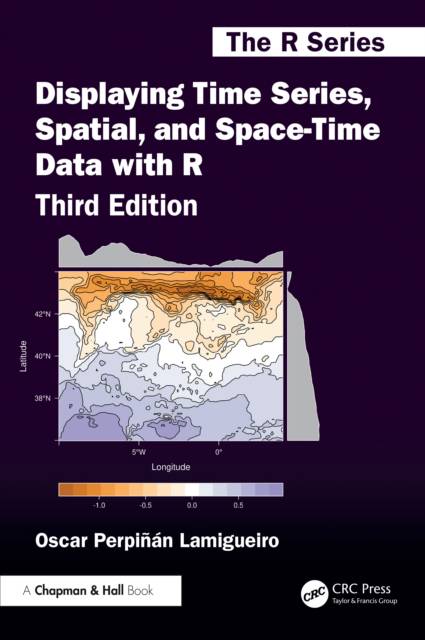
Displaying Time Series, Spatial, and Space-Time Data with R
Oscar Perpinan Lamigueiro
450,45 €
+ 900 points
Format
Description
Focusing on the exploration of data with visual methods, the book presents methods and R code for producing high-quality static graphics, interactive visualizations, and animations, of time series, spatial, and space-time data. Practical examples using real-world datasets help you understand how to apply the methods and code.
Spécifications
Parties prenantes
- Auteur(s) :
- Editeur:
Contenu
- Nombre de pages :
- 294
- Langue:
- Anglais
- Collection :
Caractéristiques
- EAN:
- 9781032776217
- Date de parution :
- 10-11-2025
- Format:
- Livre relié
- Format numérique:
- Genaaid
- Dimensions :
- 156 mm x 234 mm
- Poids :
- 612 g


Seulement chez Librairie Club
+ 900 points sur votre carte client de Librairie Club
Cadeau


Les avis
Nous publions uniquement les avis qui respectent les conditions requises. Consultez nos conditions pour les avis.