
- Retrait en 2 heures
- Assortiment impressionnant
- Paiement sécurisé
- Toujours un magasin près de chez vous
- Retrait en 2 heures
- Assortiment impressionnant
- Paiement sécurisé
- Toujours un magasin près de chez vous


9,95 €
+ 19 points
Format
Description
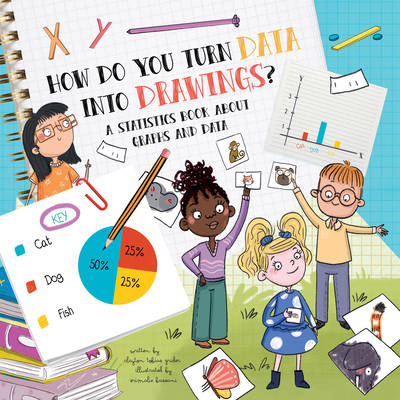
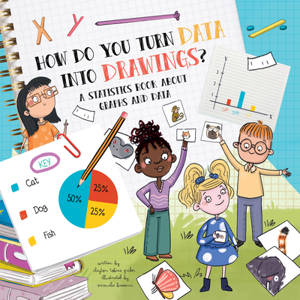
Have you ever wondered how to turn data into graphs and charts? A basic explanation of statistics concepts including descriptive and inferential statistics, collecting and recording data, how to make various graphs, and more is explored through charts, illustrations, and informative text in this new addition to the How Do series. Includes activities in the back of the book.
About the How Do series: These fully-illustrated nonfiction picture books are a great introduction to various STEM topics. Each title includes facts and figures, simple diagrams and hilarious illustrations and is written in a question-and-answer format to encourage readers to ask questions and guess the answers before exploring the science behind the correct answers.Spécifications
Parties prenantes
- Auteur(s) :
- Editeur:
Contenu
- Nombre de pages :
- 32
- Langue:
- Anglais
- Collection :
Caractéristiques
- EAN:
- 9781486729852
- Date de parution :
- 12-03-24
- Format:
- Livre broché
- Format numérique:
- Trade paperback (VS)
- Dimensions :
- 135 mm x 193 mm
- Poids :
- 104 g


Seulement chez Librairie Club
+ 19 points sur votre carte client de Librairie Club
Cadeau


Les avis
Nous publions uniquement les avis qui respectent les conditions requises. Consultez nos conditions pour les avis.